
Sensor photo : click to enlarge.

We fabricated a touch probe sensor using a longitudinal vibrator. The vibration was generated by the hydrothermaly deposited PZT thin film[4]. This previous sensor consisted of a rod vibrating in the axial direction. Its length was 27.8 mm and its resonance frequency was 116 kHz. The resolution was higher than 67 nm. However, the pick-up voltage contained offset value. So the sensitivity will be improved by reducing the offset.
In this paper, in order to obtain much higher sensitivity, we have fabricated a much smaller and flat-type sensor.
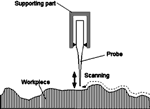 The schematic view of the measurement using the touch probe sensor is shown on the right.
The sensor consist of a half wave length longitudinally vibrating oscillator.
An exponential horn enlarges the amplitude of vibration.
When the tip end of the horn touches the surface of the workpiece, the resonance frequency of the vibrator shifts.
By continuously detecting the contact along the surface, the surface shape of the workpiece can be obtained.
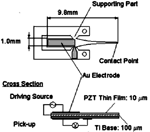 The structure of the touch probe sensor is shown on the right.
The vibrator length was 9.8 mm.
The step-up ratio of the exponential horn was 3.2.
The base material of the vibrator was titanium substrate.
The thickness of this substrate was 100 µm.
On the surface of the Ti substrate, we deposited PZT thin film by the hydrothermal method[5,6].
The thickness of PZT film was about 7 µm each side.
The electrodes deposited on the surface of the PZT film were used for the drive and the pick-up.
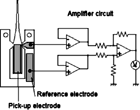 In order to reduce the influence of the offset, we use and a differential amplifier.
This is because the offset would be mainly due to the leakage between the supply and the pick-up wires.
As shown on the right, the pick-up voltage was defined as the deference between the voltage of the pick-up electrode and that of the reference electrode.
The differential amplifier circuit gain was 10.
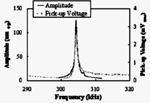 To evaluate the relationship between the vibration amplitude and the pick-up voltage, the velocity of the vibrator tip and the output voltage of the amplifier were measured.
The driving voltage was 3 Vp-p.
The results are shown on the right.
The plots of the pick-up voltage are the values of measurement results divided by amplifier gain.
The amplitude and the pick-up voltage had a peak at 304.35 kHz.
At that frequency, the amplitude was 126 nmo-p and the mechanical Q value was 705.
The pick-up voltage was 3.36 mVrms.
From the plots of the pick-up voltage, the offset value was small enough.
It can be said that the resonance frequency can be detected from the peak value of the pick-up voltage.
 To evaluate the sensitivity and the resolution of the sensor, we measured the relationship between the pick-up voltage and the tip-workpiece displacement.
The results are shown on the right.
The pick-up voltage was measured when the workpiece was brought close to the vibrator tip.
The plots of pick-up voltage has not divided by the amplifier gain.
The plots describes the force curve.
From the left hand of the graph, each area corresponds to (A) the freely vibration, (B) the tapping vibration, and (C) the contact.
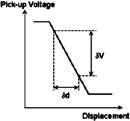 From the change of the relationship between the displacement and the pick-up voltage, the sensitivity and the resolution of this sensor is obtained.
The sensitivity can be defined as the tangent of the tapping mode in the figure.
This equals to the change of the pick-up voltage, delta V in the figure on the right, divided by the change of the amplitude of vibration, delta d.
From the slope of the curve in the previous figure, the sensitivity was 2.0x10⁻² mV/nm.
The resolution equals to the minimum detectable voltage divided by the sensitivity.
The minimum detectable voltage is defined as the equivalent noise level of the amplifier at the input terminal.
From the measurement of the noise level and the sensitivity, the resolution was 2.4 nm.